![]()
Charts 2.2.0
This release adds a new chart type, improves chart controls, and introduces modular publishing options.
What's New in 2.2.0
Release highlights
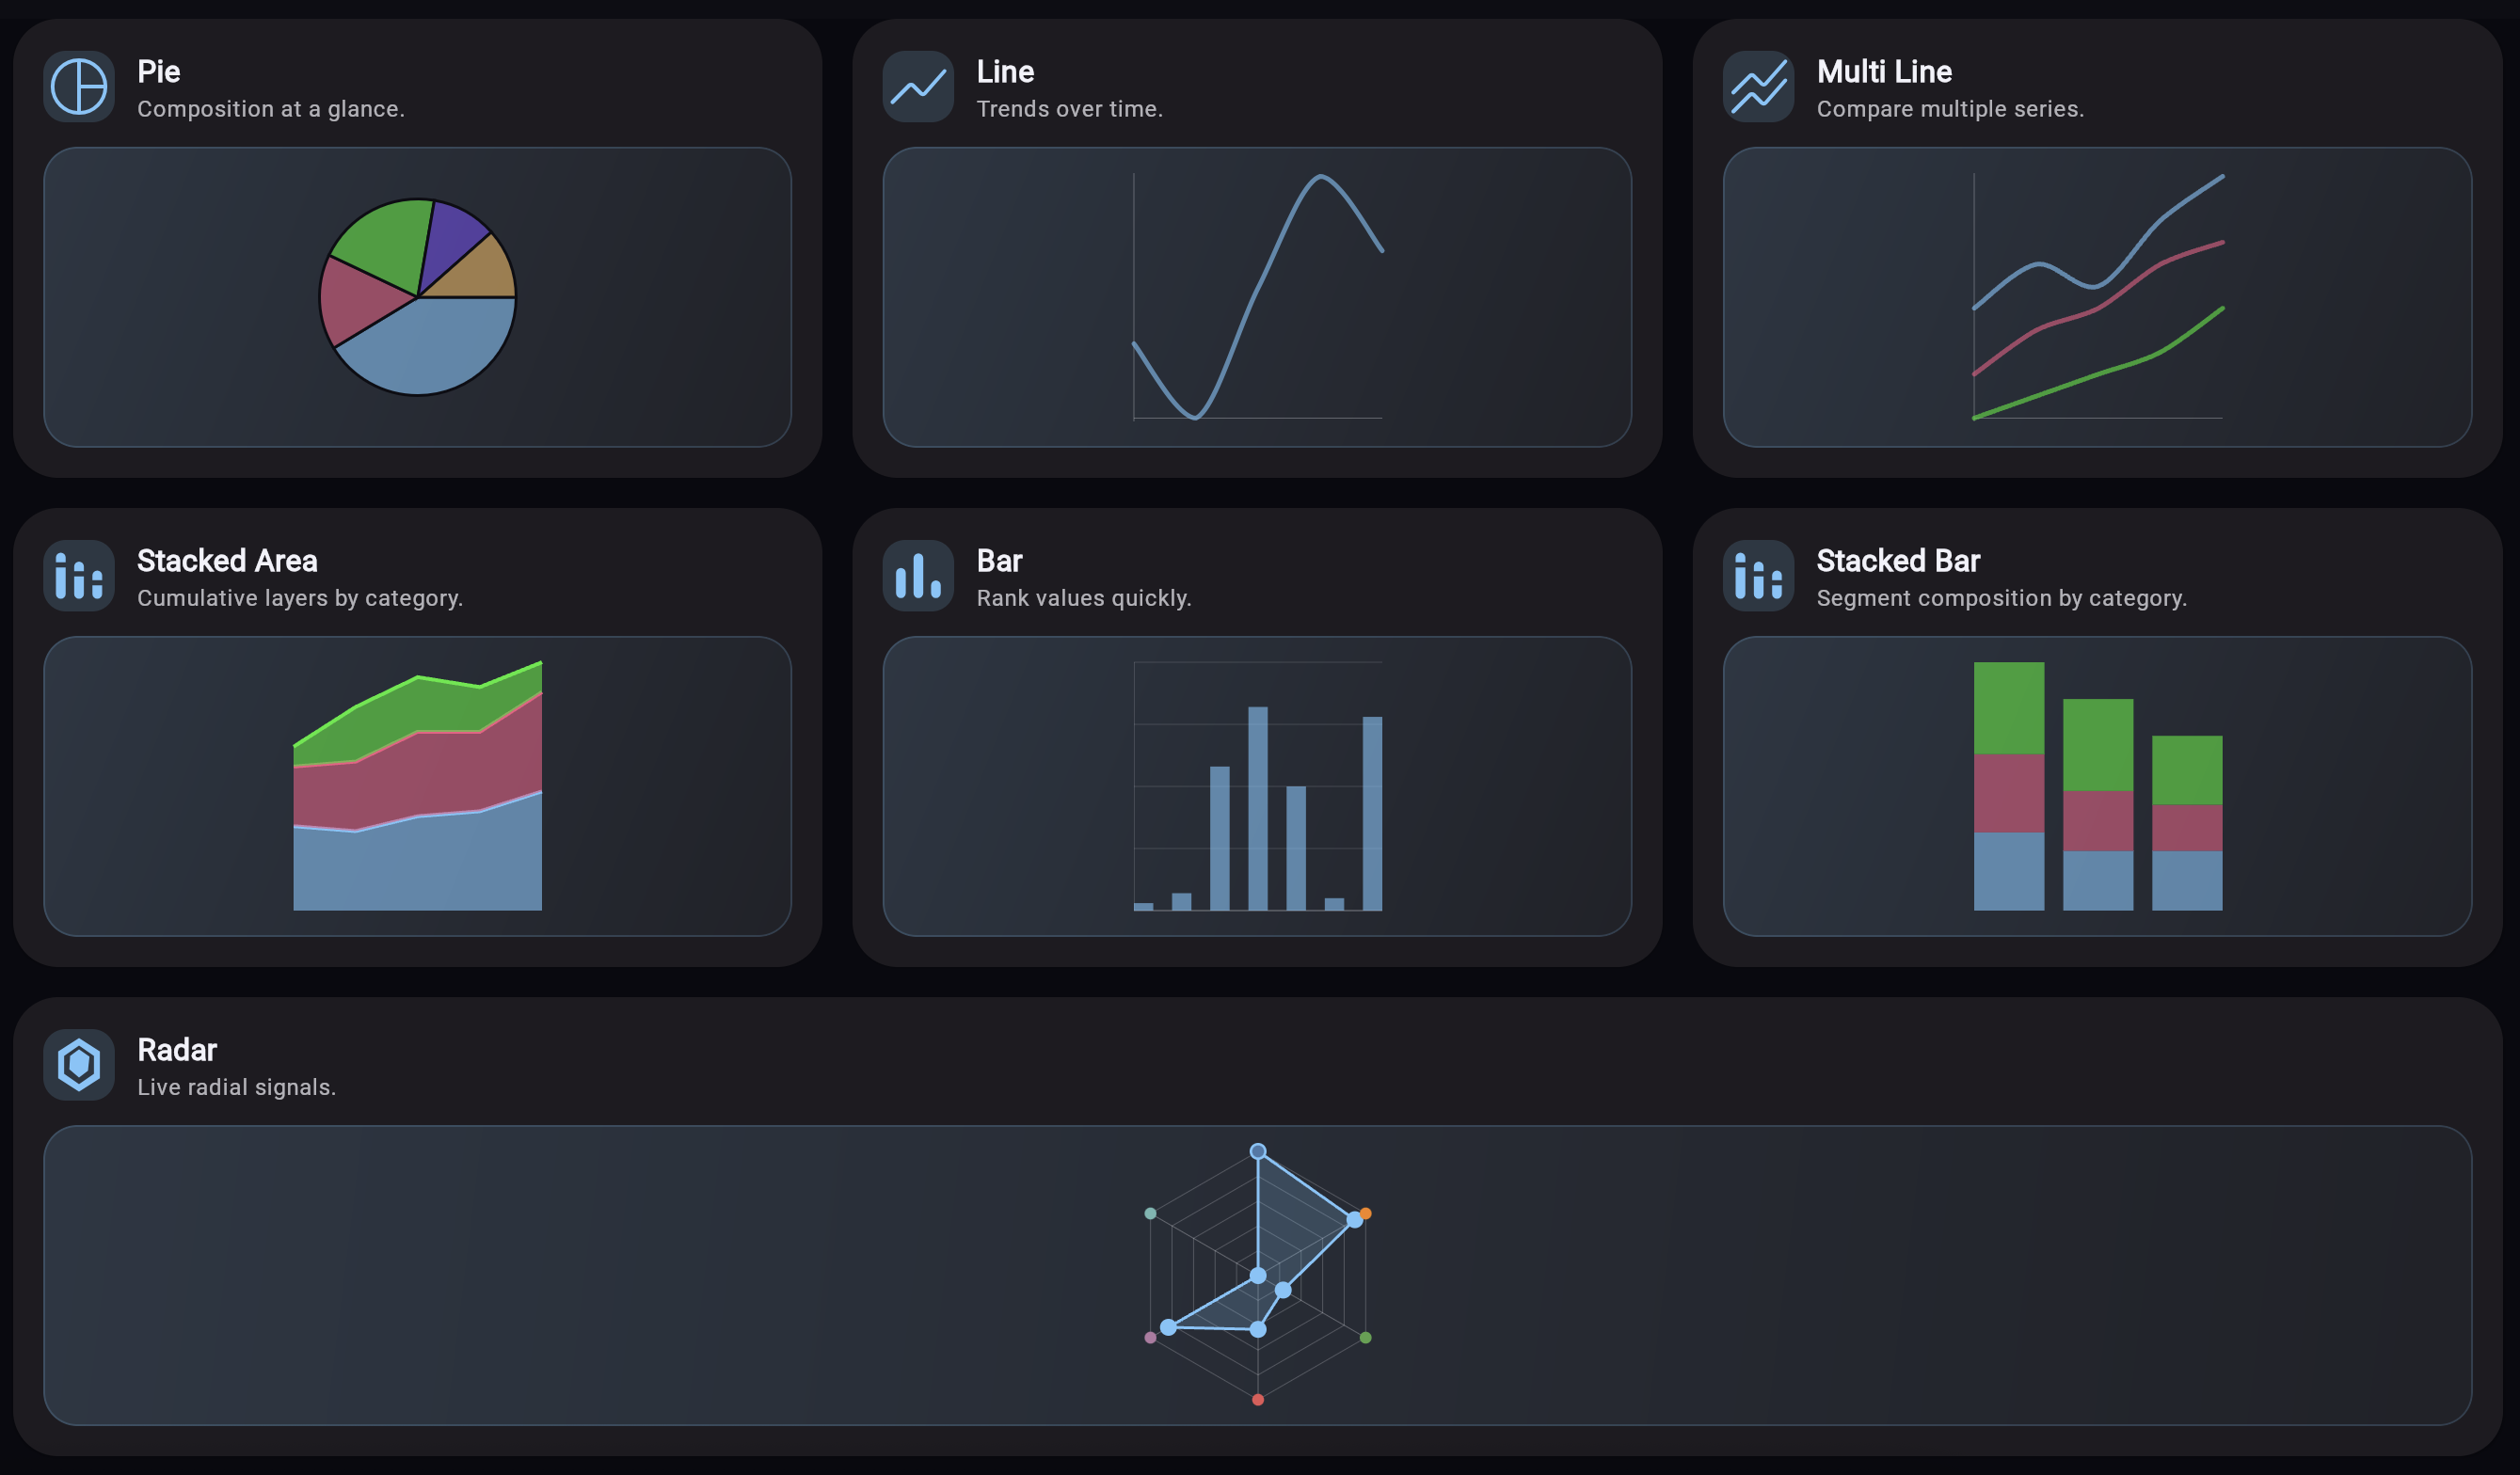
- Introduced modular publishing + BOM support, while keeping the umbrella dependency option.
- Improved large-data chart handling with smoother scrolling and zoom across all chart types.
- Added axes support across all chart types for clearer labels and easier reading.
- Added new line chart animation modes (
Morph,Timeline) for different data update flows. - Added
StackedAreaChartas a new core chart type. - Improved the demo gallery layout and navigation for easier browsing.
- Updated examples with cleaner, default-focused chart demos.
- Launched a charts Playground.
Modular publishing updates
Use the umbrella artifact (same behavior as before):
implementation("io.github.dautovicharis:charts:<version>")Use modular artifacts (pick what you need):
implementation("io.github.dautovicharis:charts-core:<version>")
implementation("io.github.dautovicharis:charts-line:<version>")
implementation("io.github.dautovicharis:charts-pie:<version>")
implementation("io.github.dautovicharis:charts-bar:<version>")
implementation("io.github.dautovicharis:charts-stacked-bar:<version>")
implementation("io.github.dautovicharis:charts-stacked-area:<version>")
implementation("io.github.dautovicharis:charts-radar:<version>")
Use BOM for aligned versions (where Gradle platforms are supported):
implementation(platform("io.github.dautovicharis:charts-bom:<version>"))
implementation("io.github.dautovicharis:charts-core")
implementation("io.github.dautovicharis:charts-line")
implementation("io.github.dautovicharis:charts-pie")
implementation("io.github.dautovicharis:charts-bar")
implementation("io.github.dautovicharis:charts-stacked-bar")
implementation("io.github.dautovicharis:charts-stacked-area")
implementation("io.github.dautovicharis:charts-radar")
Getting Started
New to Charts? Check out our Getting Started Guide to learn how to integrate the library into your project and create your first charts in minutes.